Performance bar (FREE SELF)
- The Stats field introduced in GitLab 13.9.
- The Memory field introduced in GitLab 14.0.
- The Flamegraph field introduced in GitLab 14.4.
You can display the performance bar to see statistics for the performance of a GitLab UI page. For example:

Available information
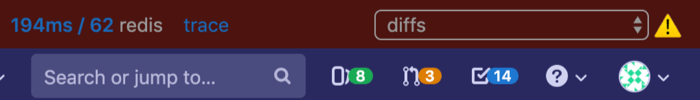
From left to right, the performance bar displays:
- Current Host: the current host serving the page.
-
Database queries: the time taken (in milliseconds) and the total number
of database queries, displayed in the format
00ms / 00 (00 cached) pg. Click to display a modal window with more details. You can use this to see the following details for each query:- In a transaction: shows up below the query if it was executed in the context of a transaction
- Role: shows up when Database Load Balancing is enabled. It shows which server role was used for the query. "Primary" means that the query was sent to the read/write primary server. "Replica" means it was sent to a read-only replica.
-
Config name: shows up only when the
GITLAB_MULTIPLE_DATABASE_METRICSenvironment variable is set. This is used to distinguish between different databases configured for different GitLab features. The name shown is the same name used to configure database connections in GitLab.
- Gitaly calls: the time taken (in milliseconds) and the total number of Gitaly calls. Click to display a modal window with more details.
- Rugged calls: the time taken (in milliseconds) and the total number of Rugged calls. Click to display a modal window with more details.
- Redis calls: the time taken (in milliseconds) and the total number of Redis calls. Click to display a modal window with more details.
- Elasticsearch calls: the time taken (in milliseconds) and the total number of Elasticsearch calls. Click to display a modal window with more details.
- External HTTP calls: the time taken (in milliseconds) and the total number of external calls to other systems. Click to display a modal window with more details.
-
Load timings of the page: if your browser supports load timings (Chromium
and Chrome) several values in milliseconds, separated by slashes.
Click to display a modal window with more details. The values, from left to right:
- Backend: time needed for the base page to load.
- First Contentful Paint: Time until something was visible to the user.
- DomContentLoaded Event.
- Total number of requests the page loaded.
- Memory: the amount of memory consumed and objects allocated during the selected request. Select it to display a window with more details.
-
Trace: if Jaeger is integrated, Trace links to a Jaeger tracing page
with the current request's
correlation_idincluded. -
+: a link to add a request's details to the performance bar. The request
can be added by its full URL (authenticated as the current user), or by the value of
its
X-Request-Idheader. - Download: a link to download the raw JSON used to generate the Performance Bar reports.
-
Flamegraph with mode: a link to generate a flamegraph
of the current URL with the selected Stackprof mode:
- The Wall mode samples every interval of the time on a clock on a wall. The interval is set to
10100microseconds. - The CPU mode samples every interval of CPU activity. The interval is set to
10100microseconds. - The Object mode samples every interval. The interval is set to
100allocations.
- The Wall mode samples every interval of the time on a clock on a wall. The interval is set to
- Request Selector: a select box displayed on the right-hand side of the Performance Bar which enables you to view these metrics for any requests made while the current page was open. Only the first two requests per unique URL are captured.
-
Stats (optional): if the
GITLAB_PERFORMANCE_BAR_STATS_URLenvironment variable is set, this URL is displayed in the bar. In GitLab 13.9 and later, used only in GitLab SaaS.
NOTE: Not all indicators are available in all environments. For instance, the memory view requires running Ruby with specific patches applied. When running GitLab locally using GDK, this is typically not the case and the memory view cannot be used.
Keyboard shortcut
Press the p + b keyboard shortcut to display the performance bar, and again to hide it.
For non-administrators to display the performance bar, it must be enabled for them.
Request warnings
Requests that exceed predefined limits display a warning {warning} icon and explanation next to the metric. In this example, the Gitaly call duration exceeded the threshold.

If any requests on the current page generated warnings, the warning icon displays
next to the Requests selector menu. In this selector menu, an exclamation (!)
appears next to requests with warnings.
Enable the performance bar for non-administrators
The performance bar is disabled by default for non-administrators. To enable it for a given group:
- Sign in as a user with Administrator role.
- On the top bar, select Menu > Admin.
- On the left sidebar, select Settings > Metrics and profiling
(
admin/application_settings/metrics_and_profiling), and expand Profiling - Performance bar. - Click Allow non-administrators access to the performance bar.
- In the Allow access to members of the following group field, provide the full path of the group allowed to access the performance.
- Click Save changes.